Short answer
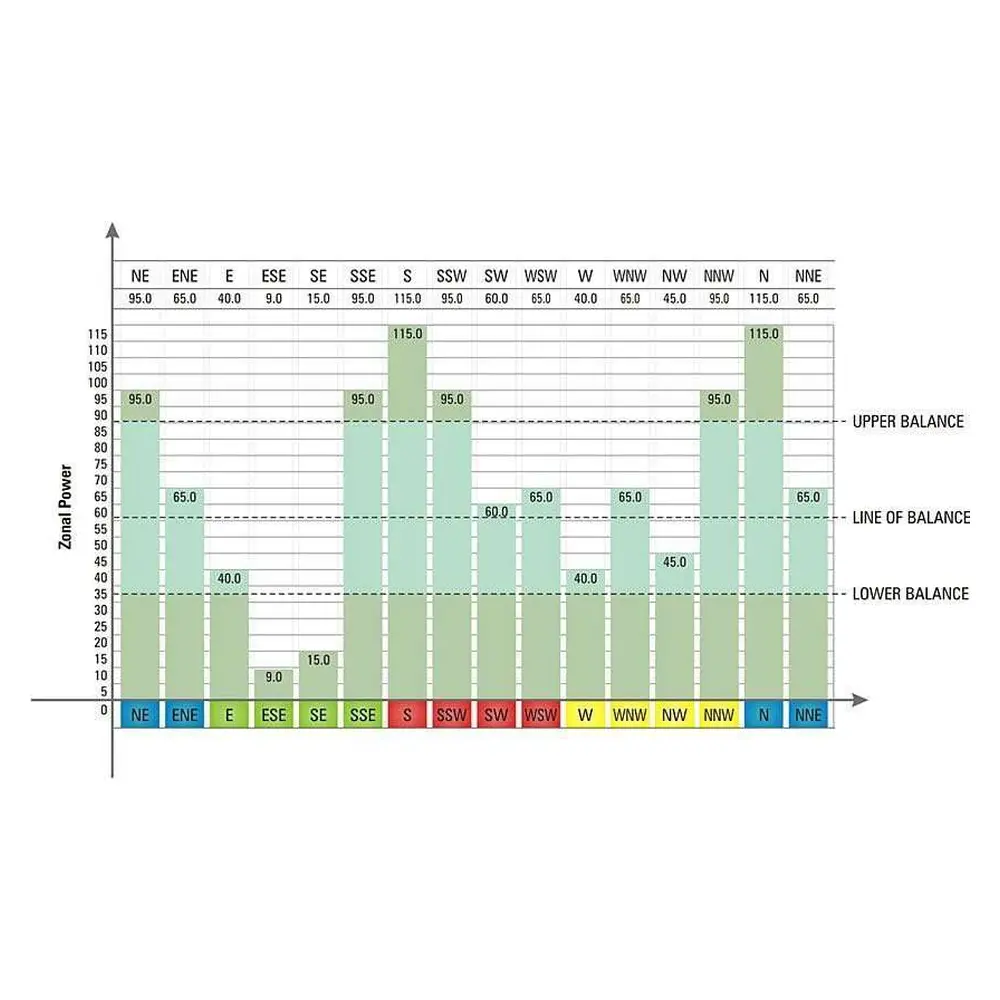
To make a Vastu grid, first find the house in Google Earth and read its degree, then rotate the map in AutoCAD by that angle. Draw a corner-to-corner cross to find the centre and place the Shakti Chakra on it. Then enter the length, width and degree in the Excel sheet and it makes the bar chart.
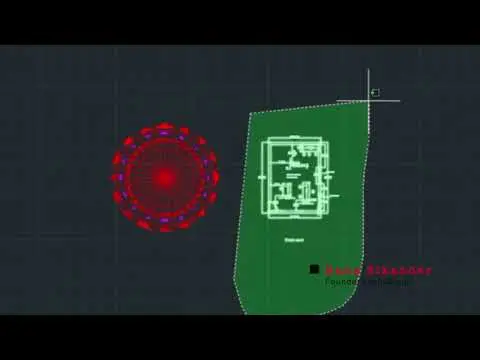
▶ Watch the full video · 11 min · Vastu Guruji (in Hindi)
What you will learn
In this lesson Guruji shows how to make the grid of a plot or a house, how to take the degree from Google, and, once the grid is ready, how to make the bar chart of the same house. For this the Vastu Guruji brand has made two small files: one to make the grid and one to get the bar chart.
Which apps you need
- Google Earth — to find the house and see its degree.
- AutoCAD — to put the grid on the map. Its educational version is available free.
- MS Office (Excel) — to open the bar chart sheet.
Taking the degree from Google Earth
Guruji searches for the Vastu Guruji office in Raipur in Google Earth. As soon as the name is typed, Google takes you to that place. Then go to View → Reset → Tilt and Compass. The building that was showing in 3D now comes straight from above, in 2D.
Now the degree of the building is read. In his example it came to about 166 degrees. A difference of one or two degrees is fine. Remember this number, because you will use it in two places later.
In Guruji’s method, 180 degrees is taken as full East. A reading of 166 means it is about 14–15 degrees short of 180; adding that much completes the 180.
The map and the grid file in AutoCAD
Now open the house map in AutoCAD. The grid file is very simple: a few circles and a few lines. You can also make it yourself. The example plot is about 24 ft 3 in long and 17 ft 10 in wide. These sizes are needed again for the bar chart.
Guruji advises getting the map made by a professional, so the measurements are correct and it also shows properly where each table and item is placed.
Then turn the map with the Rotate command: select the map, give Rotate, pick one end and turn it. In his example one part of the building comes to the East, the window side comes to the North and the door comes to the South. The same roughly 15 degrees found from Google is used for the turn. After this the Google picture and the map look the same. (For the basics of directions, see the article on directions in Vastu Shastra.)
Find the centre and place the chakra
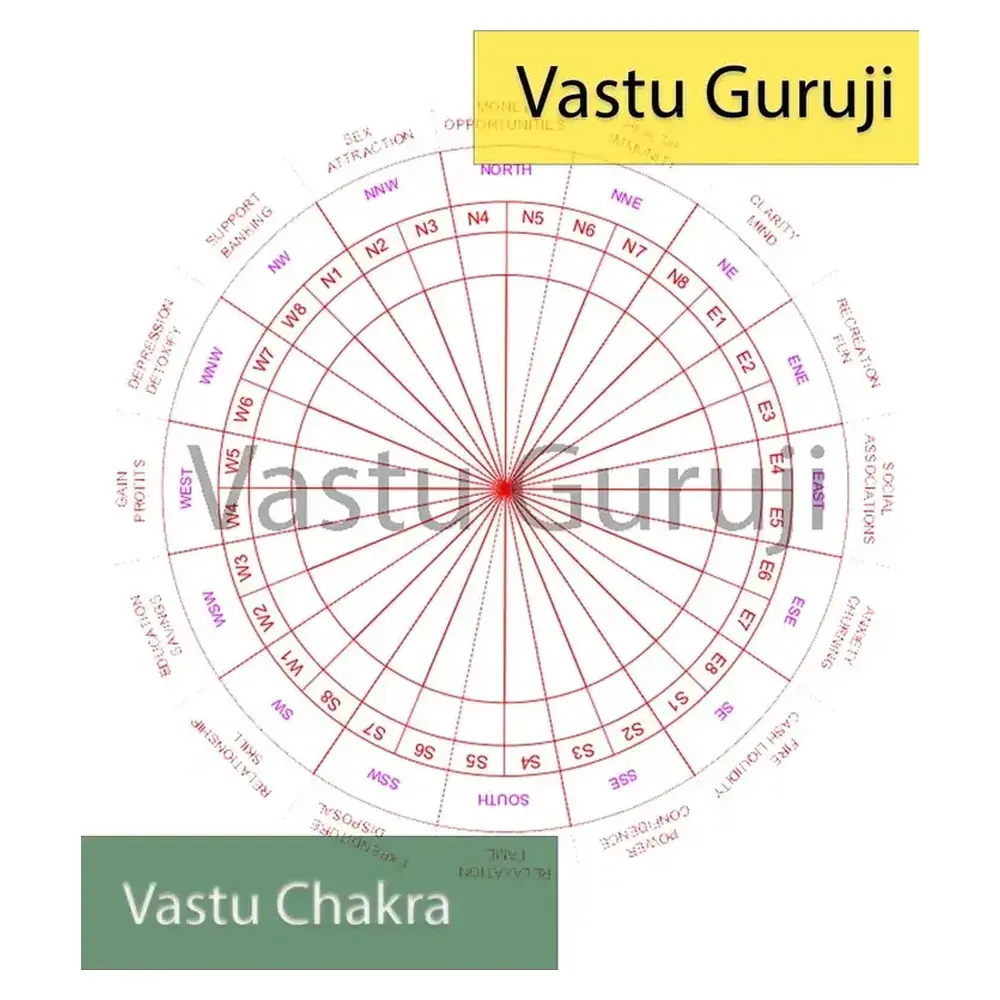
Now find the centre of the house. Draw lines from corner to corner to make a cross. Make sure all four lines meet the corners exactly. Then place the Shakti Chakra straight on that centre, without changing anything in it. Now all the zones show up separately. (If you do not have the chakra, you can see it in the free Vastu Chakra PDF.)
| Step | App | What to do |
|---|---|---|
| 1 | Google Earth | Find the house, reset Tilt and Compass, read the degree (example: 166) |
| 2 | — | Work out the gap from 180 (example: about 15 degrees) |
| 3 | AutoCAD | Open the map and Rotate it by that many degrees |
| 4 | AutoCAD | Draw a cross from the corners to find the centre |
| 5 | AutoCAD | Place the Shakti Chakra on the centre — the grid is ready |
| 6 | Excel | Enter length, width and degree — the bar chart is ready |
The bar chart from the Excel sheet
For the bar chart, open the Excel sheet. Enter the width and length of the plot in feet. The sheet does not take inches, so turn the inches into a decimal; for example 17 ft 10 in was entered as about 17.8. Then enter the Google degree as it is; in the example, 166.02 degrees.
As soon as you press Enter, the sheet makes the full bar chart, without any effort. If you want, you can also print it with the measurements of all the zones.
Cross-checking with the AREA command
Guruji shows how much work it is to measure each zone by hand. In AutoCAD he measured the North zone (from N4 to N5, up to the centre) with the AREA command and got about 17; the Excel sheet also showed 17 for North. The East zone came to 31.7, and the sheet showed 31. So the sheet gives at once the same values that take a long time to work out by hand.
Tip: leave the big zones alone, grow the small ones
Once the bar chart is made, do not do any work on the zones that are big. Work on the zones that are small, so that they grow. Guruji’s example: if a big tree is already giving fruit, you should look after the small trees and plants. Big trees will stay big, so do not try to make them smaller; small trees are still growing, so try to make them bigger.
The sheet also lists the zones, so you can go straight to one zone. If, say, SSE, South or North is small, work can be done on those zones. Small items can be used for this, such as horses, elephants, pyramids or devta idols; in the example he speaks of improving a zone by keeping red horses there.
- Take the degree from Google Earth; one or two degrees of difference is fine.
- Get the map made by a professional so sizes and item positions are correct.
- Find the centre with a corner-to-corner cross.
- The bar chart shows which zone is big and which is small.
- Keep big zones as they are; grow the small zones.
Frequently asked questions
How to make a Vastu grid on a house map?
Rotate the map in AutoCAD by the degree taken from Google, draw a corner-to-corner cross to find the centre, and place the Shakti Chakra on that centre. All the zones then show up separately.
How to find the degree of a house on Google Earth?
Search for the house in Google Earth, then use View → Reset → Tilt and Compass so the building shows from above in 2D. Then read the building's degree; one or two degrees of difference is fine.
How to make a Vastu bar chart?
In the Excel bar chart sheet, enter the plot's length and width in feet (inches turned into a decimal) and the degree from Google. Press Enter and the sheet makes the bar chart with the measurements of all zones.
Which software is needed to make a Vastu grid?
Google Earth (for the degree), AutoCAD (for the grid; its educational version is free) and MS Office Excel (for the bar chart).
What to do if a zone is small in the Vastu bar chart?
Guruji says leave the big zones alone and work on the small zones so they grow. Small items such as horses, elephants, pyramids or devta idols can be used for this.
Products used in this lesson
 Vastu Bar Chart (Soft Copy) Original price was: ₹999.₹890Current price is: ₹890.View →
 Vastu Chakra (Autocad File DWG) Original price was: ₹1,999.₹790Current price is: ₹790.View →
 Course on Barchart & Map Grid Original price was: ₹18,000.₹13,000Current price is: ₹13,000.View →
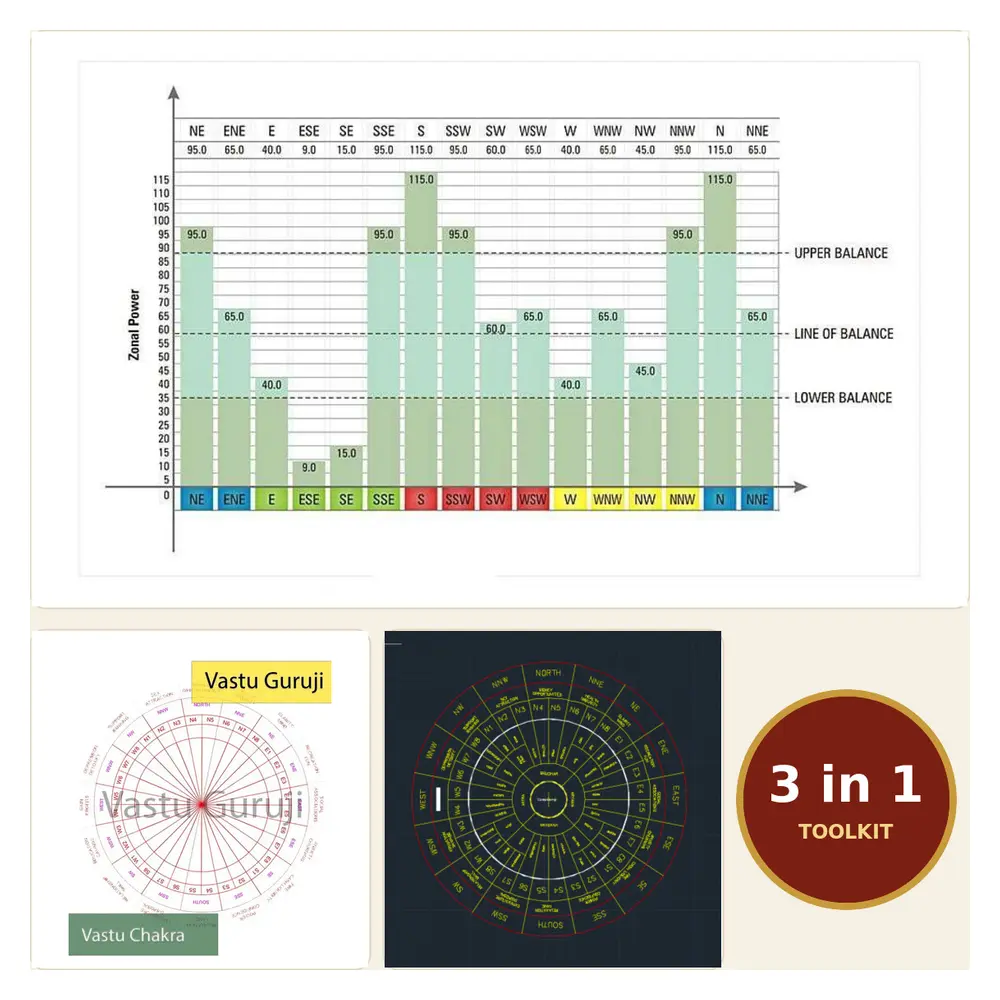 Vastu Consultant Toolkit — Bar Chart + Vastu Chakra + Devta Chakra (DWG / soft copy) Original price was: ₹3,070.₹1,990Current price is: ₹1,990.View →
All payments online — UPI / PhonePe / GPay / card.
📖 Read more: घर के लिए ज़रूरी वास्तु टिप्स — detailed guide by Vastu Guruji Rana Sikander (vastuguruji.in).